Business Process Modeling – Tools and Techniques
Continuing with our series of blogs on business process management, we have touched upon the core aspects of business process modeling including a layman overview, an advanced perspective of the concept, business process integration, and business process re-engineering.
Next up, we’ll understand the fundamental tools and techniques of business process management in this blog. But before we dig into the techniques, let’s have a look back at the definition first.
Techopedia defines business process modeling as:
A business process model is often presented as a simple visual. Items like flowcharts, Gantt charts or PERT diagrams are used to provide a visual model. These models serve to analyze workflow and other aspects of a business process anywhere in the broader context of a comprehensive business model.
In simple words, business process modeling is the visual representation of a business operation, entailing all of the tasks, terminals, elements, and visuals in a well-defined sequential manner. Since a process model is represented in the form of a graphical illustration or diagram, it requires a set of tools and various techniques to create a process model.
Business Process Modeling Tools
Depending on the type of interface, most business process modeling software are based on the following BPM tools.
Coding/Development
Coding or programming development is probably one of the oldest and most conventional techniques of business process modeling. It involves a separate code for each individual task written manually by a programmer to create and represent a workflow. Manual coding of tasks makes it a tedious BPM tool, and since the minutest of changes can only be made by the programmer, there is a lot of redundancy involved in the process.
Data Entry
The redundancies present in the manual coding of BPM created the need for more advanced and automated BPM tools. Hence came BPM software with a data entry based interface, where individuals would only need input required data and generate their process models.
Activity Visualization
This interface allows users to create activities and events, and integrate them into the model as part of the workflow. This offers a lot of flexibility to the user, as in, they can pause the flow at a specified interval and decide what happens what happens before or after a particular event or activity.
Procedure Visualization
As the name implies, it is a simplified representation of a business process, queued in a sequential series of steps, as in step 1, step 2, step 3. The process is represented in a stringent business context, without clouding the model with unnecessary considerations.
Business Process Modeling Techniques
Since the process model for each business procedure is tailor-made, there’s no one fixed way to go about creating a business process model. In fact, there are approximately around 12-15 techniques commonly used for business process modeling. Some of them include:
- UPN – Universal Process Notation
A simplified approach to describing process flows using visual diagrams; as the name implies, this technique is highly flexible and can be used for most business process models.
- BPMN – Business Process Modeling Notation
This technique was designed to cover this wide range of usage and allows modeling of end-to-end business processes. An end-to-end BMPN model constitutes three sub-models:
- Private (internal) business processes,
- Abstract (public) processes, and
- Collaboration (global) processes
- IDEF – Integrated Definition for Function Modeling
A method designed to model the decisions, actions, and activities of an organization or system; it is particularly more useful in outlining the scope of analysis, and enhances domain expert involvement and consensus decision-making through simplified graphical devices
- PERT Diagrams
A PERT (Program Evaluation Review Technique) chart is popular project management and business process modeling tool that graphs a project's timeline by task.
- Petri-Nets
A basic model of parallel and distributed systems, constituting directed nodes or arcs connecting places and transitions
A useful graphical tool, mostly used in project management, which shows activities or tasks performed, in chronological order, strictly aligned against time
***
At Infowise, we are serving as a strategic partner, assisting public and private enterprises in their digital transformation endeavors with our scalable, smart and futuristic tools, software and applications. Our product Infowise Ultimate Forms contains more than 15 standalone SharePoint applications developed to give you the power to innovate, automate and scale up your processes. Our products have been designed for optimum interoperability and seamless integration within SharePoint. Altogether, they constitute the structural foundation for digitization and facilitate your transition to digital transformation.
Add your comment
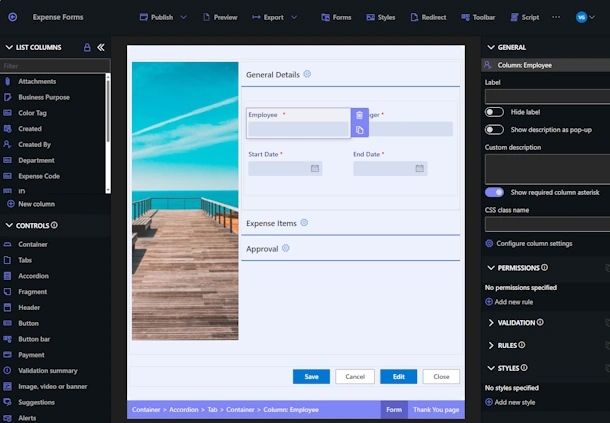
Flexible Forms
Convenient responsive modern forms, featuring tabs, section and column permissions, dynamic rules, repeating sections, electronic signatures and input validation, while keeping all your data safely inside SharePoint.
Smart dynamic SharePoint forms provide an exceptional user experience, improve data quality and simplify business processes, saving you valuable resources.
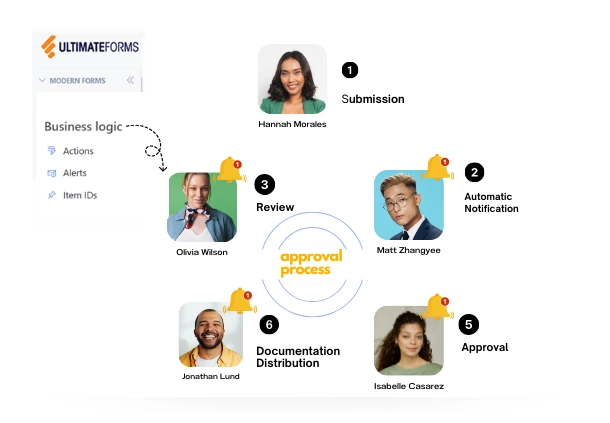
Intuitive Automation
Replace complex SharePoint and Power Automate workflows with simple, but versatile Actions to create and update data inside SharePoint and in a variety of integrated applications, such as Exchange, MS SQL, Teams and many more.
By reducing the learning curve, you empower more people in your organization to create and manage business solutions, successfully removing bottlenecks.
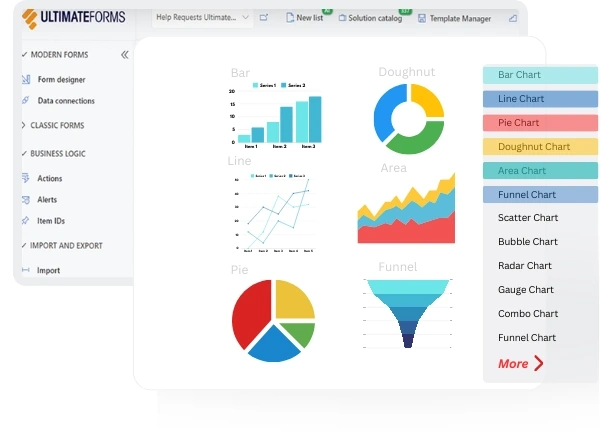
Clear Reporting
Present data as actionable insights with detailed shareable reports, dashboards, KPIs, calendars and charts.
Everyone is able to visualize information in an accessible fashion, improving responsiveness and accountability.
100’s of Templates